
In the intricate framework of the U.S. economy, real estate represents not just transactions but the embodiment of American aspirations. Spanning from the tranquil suburbs of the Midwest to the bustling high-rises of New York City, each property serves as a chapter in the nation’s rich socioeconomic narrative. This article aims to comprehensively examine the U.S. real estate landscape, from the tumultuous historical fluctuations influenced by events like the 2008 financial crisis to the current shifts in urban housing dynamics.
So, what are the current trends looking like in 2023?
Affordability in the real estate context transcends simple property values. It encapsulates a broader economic equilibrium, balancing average incomes, mortgage rates, and regional economic factors against the timeless ambition of homeownership. With urban environments witnessing escalated housing prices and wage growth lagging, affordability emerges as a critical concern, especially for the younger demographic.
Recent trends in the real estate sector underscore a dynamic market evolution. With their promise of economic opportunity and cultural richness, metropolitan areas have driven demand, propelling property values. However, the paradigm shifts induced by the recent pandemic have reintroduced the allure of suburban residences and rural sanctuaries as flexibility in workplace norms gains prominence. Additionally, sustainability is carving its niche in the market discourse. The demand for eco-friendly, energy-efficient homes is ascending, reflecting a broader societal emphasis on environmental responsibility.
Demographically, distinct generations imprint their unique footprints on the real estate terrain. The baby boomer generation, transitioning into retirement phases, exerts considerable influence through downsizing or geographical relocations. In contrast, millennials and Gen-Z confront the property market armed with distinct priorities, often shaped by challenges such as educational loans and a volatile employment sector, navigating their path with a blend of pragmatism and aspiration.
Let’s jump into the stats shaping the previous few years and the current state of the real estate landscape.
Contents
- 1 A Snapshot of US Housing Trends
- 2 Housing Units Growth in 2021
- 3
- 4 Median House Sale Price as of July 2023
- 5 House Price Index 1991-2022
- 6 Owner-Occupied Housing Units in 2021
- 7 New Houses Sold in 2022
- 8 Rental Housing 2021
- 9 Housing Price to Income Ratio 2022
- 10 Homeownership Rate in 2022
- 11 Average Sales Price of New Homes in 2022
- 12 Number of Households in 2022
- 13 Leading Home Builders in 2022
- 14 U.S. Housing Demand: How Competitive Is the Market In 2023?
- 15 Home Purchases By Age Group in 2022
- 16 U.S. Home Purchase Trends in 2021:
- 17 Trends in U.S. Migration Patterns: Which regions are attracting and losing residents?
- 18 Mortgage Rates 2023
- 19 Building Permits Issued up to July 2023 for Residential Construction
- 20 Home Buyers and Sellers Statistics for 2022
- 21 U.S. Real Estate Insights By State: A Comprehensive Examination of Texas Trends
- 22 The Bottom Line
- 23 FAQ Section
- 23.1 How does the U.S. housing market value compare with other countries?
- 23.2 Is the median home price rise consistent across all types of homes?
- 23.3 What factors might be causing Millennials to consider buying homes due to the pandemic?
- 23.4 How has the rental market been affected during this period?
- 23.5 Are urban areas seeing a decline in interest compared to suburban or rural areas?
- 23.6 How are commercial property prices affected by the changes in the housing market?
- 23.7 Has there been an increase in housing constructions to meet the demand?
- 23.8 How has the pandemic impacted the availability of mortgage loans?
- 23.9 Are there specific regions in the U.S. that are more resilient to housing market fluctuations?
- 23.10 How might the U.S. housing market trends influence global real estate trends?
A Snapshot of US Housing Trends
A recent report by Small Business Trends showed that the overall estimated US housing stock value stands impressively at around $43.4 trillion (Source: Zippia Research). If one were to dive deeper into the sales prices, the median price for homes in the US is pegged at $436,800 (Source: Motley Fool).
However, there are stark contrasts when it comes to different states. Hawaii, known for its paradise-like allure and high living costs, has a median home value of $835,000, making it the most expensive state to purchase a house. On the other end of the spectrum, West Virginia offers a much more affordable option, with an average home price of just $147,000.
Furthermore, the Zillow Home Value Index offers another perspective, indicating that the typical US home value is $346,856.
Housing Units Growth in 2021
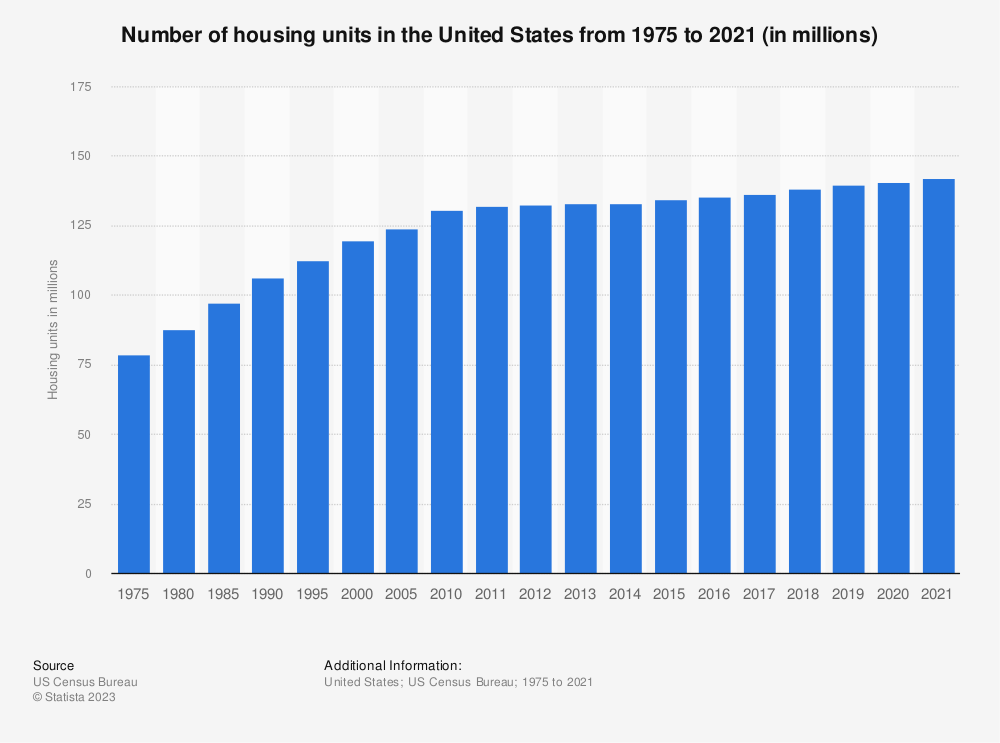
Source: Statista and US Census Bureau
In 2021, the U.S. had approximately 142 million housing units, up 1.2 million from 140.8 million in 2020.
Median House Sale Price as of July 2023
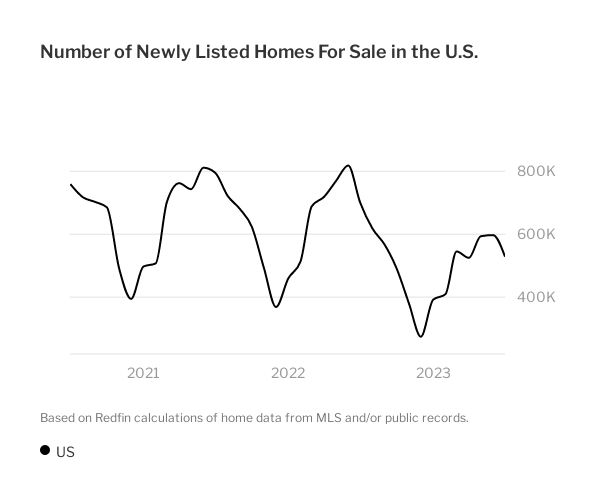
Source: Redfin
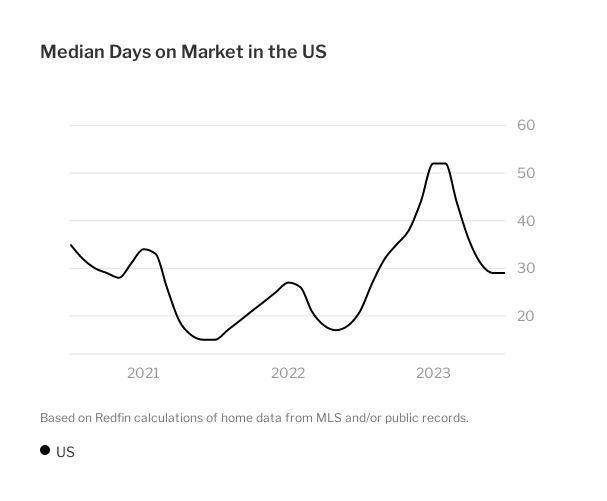
Source: Redfin
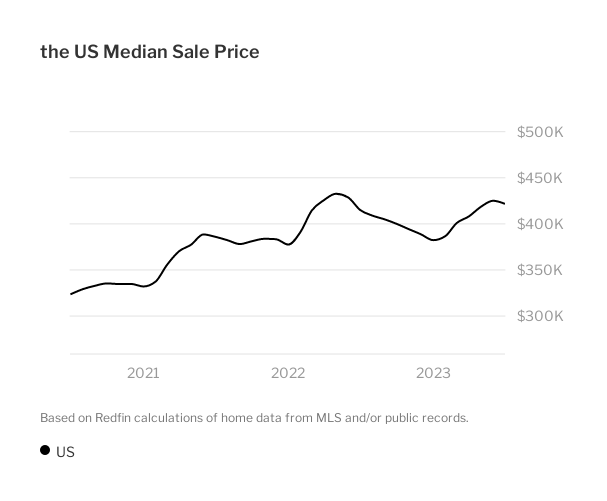
Source: Redfin
A report by Redfin shows that in July 2023, the U.S. had 1,497,358 residential properties listed for purchase, a 17.9% decrease compared to the previous year. New home listings totaled 528,490, marking a 24.6% drop from the year before. On average, properties stayed on the market for 29 days, an increase of 8 days compared to the prior year. The typical supply duration is now 2 months, showing a reduction from the previous year.
House Price Index 1991-2022
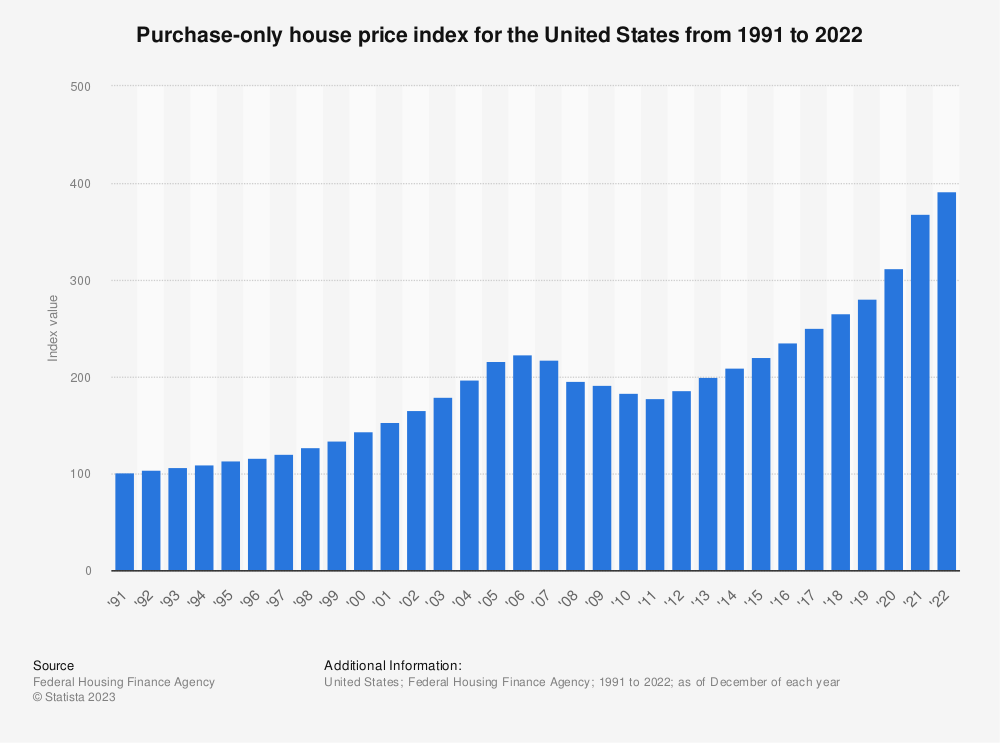
Source: Statista and Federal Housing Finance Agency
Between 1991 and 2022, the U.S. purchase-only house price index, published by the Federal Housing Finance Agency, rose from an initial value of 100 to 392.1. This index tracks the price changes of houses re-purchased at least twice.
Owner-Occupied Housing Units in 2021
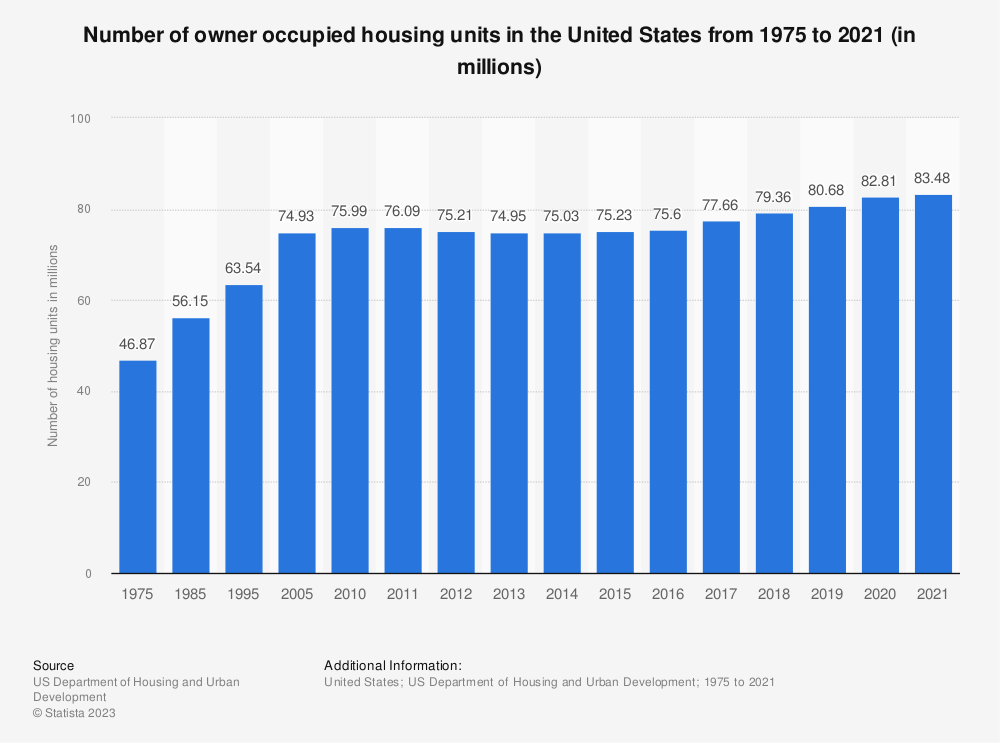
Source: Statista and US Department of Housing and Urban Development
An owner-occupied unit is a property in which the owner resides, whether fully paid or with a mortgage. After stagnating through much of the 2010s, owner-occupied housing units in the U.S. grew to 83.5 million in 2021.
This excludes rentals, employer-provided, and social housing. In contrast, renter-occupied units stood at 44 million in 2021.
Historically, renting has been cheaper in the U.S., evidenced by more monthly expenses below $1,500 in 2017. However, as house prices rise faster than rents, owning is becoming increasingly cost-effective compared to renting.
New Houses Sold in 2022
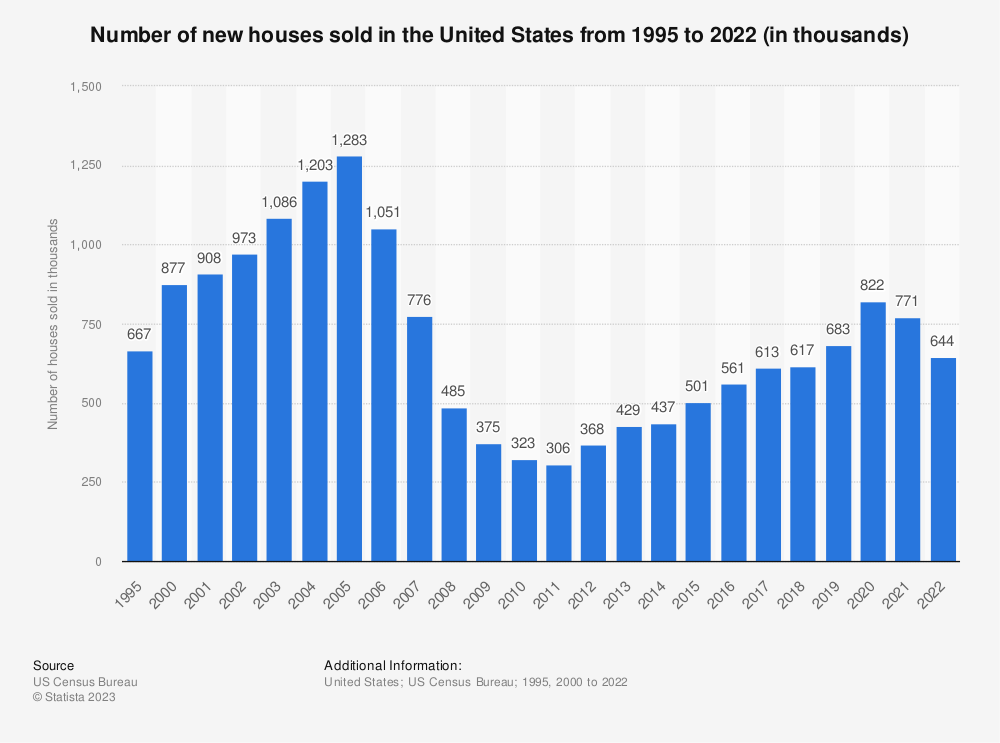
Source: Statista and US Census Bureau
During the financial crisis, U.S. new house sales plunged from 1.3 million in 2005 to 306 thousand in 2011, a 76% drop. Although the economy rebounded, consumer caution persisted.
However, by 2020 and 2021, sales surged to 822,000 and 770,000 respectively. Concurrently, the median sales price of new homes has increased, with the pandemic intensifying Americans’ interest in homeownership. It sat at 644,000 in 2022.
Rental Housing 2021
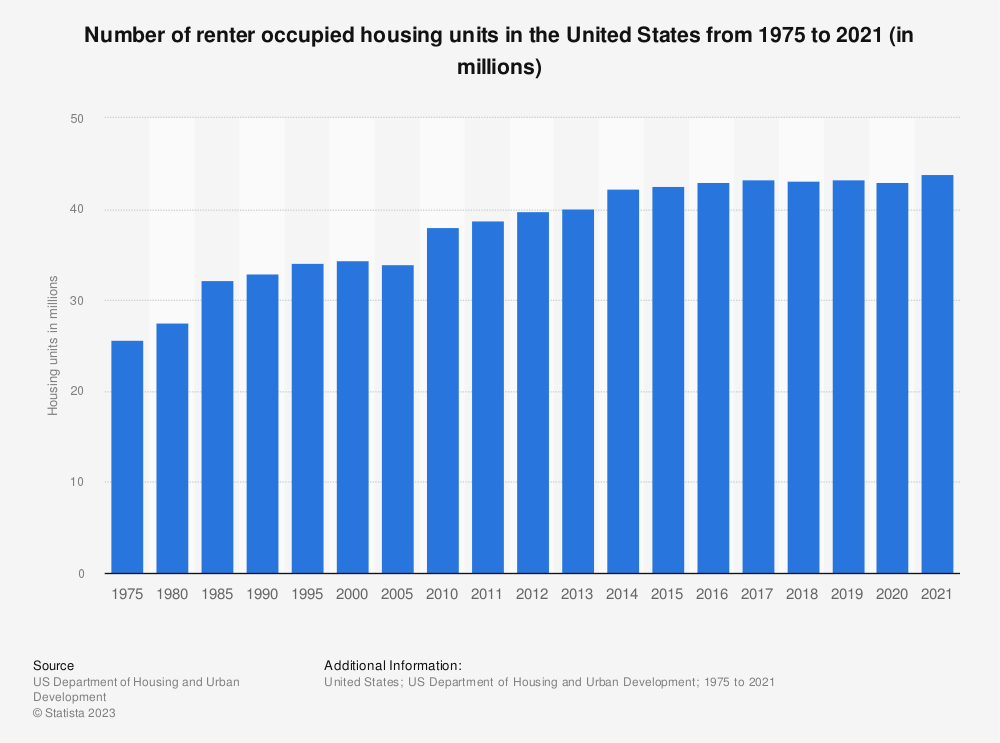
Source: Statista and US Census Bureau
In 2021, the U.S. had about 44 million rented housing units, marking an increasing trend since 1975. With declining residential vacancy rates, this highlights a growing demand for rental homes and a lagging supply. A primary reason for this surge is the unaffordability of homeownership.
A recent survey revealed that the prohibitive cost was the main reason renters didn’t own homes. While renting was cheaper than buying in states like Hawaii, Washington D.C., and Colorado in 2018, states like California, New York, and Louisiana favored homeownership costs.
Housing Price to Income Ratio 2022
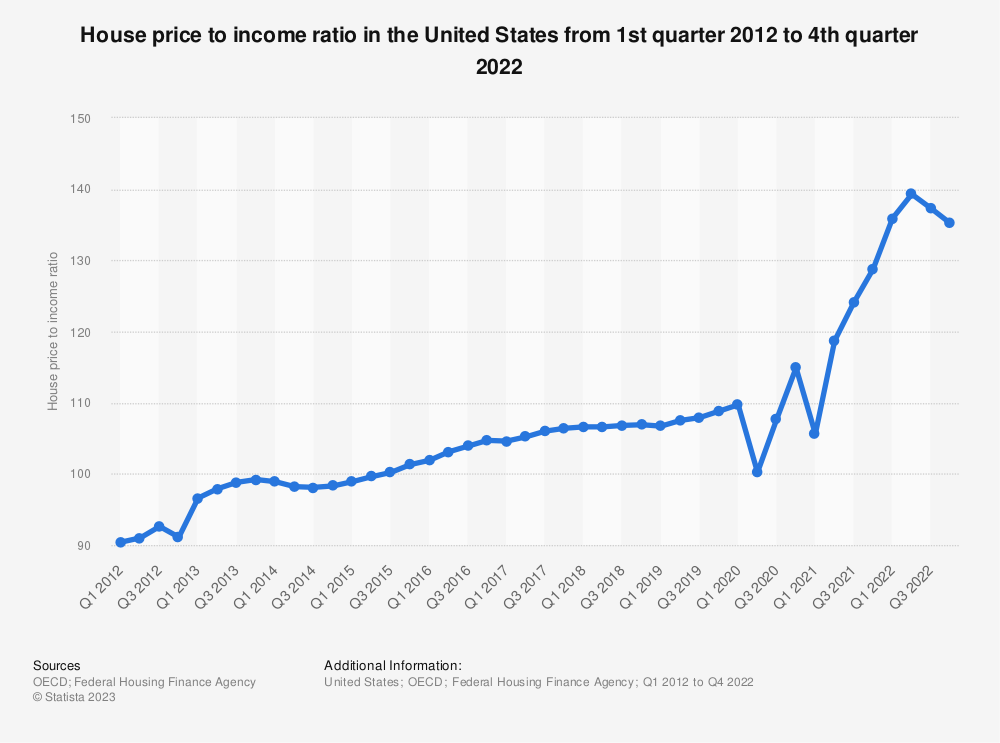
Between 2012 and 2022, the U.S. house price-to-income ratio, which gauges housing affordability, has seen significant shifts. Set with 2015 as the base year (index at 100), the ratio reached 135.2 in Q1 2022, indicating house prices grew 35% faster than incomes since 2015.
While real wages increased until 2014, they’ve plateaued since, even as single-family house prices rose, diminishing housing affordability. Consequently, the proportion of wages required for a median-priced home has escalated, underscoring the growing importance of affordable housing should this trend persist.
Homeownership Rate in 2022
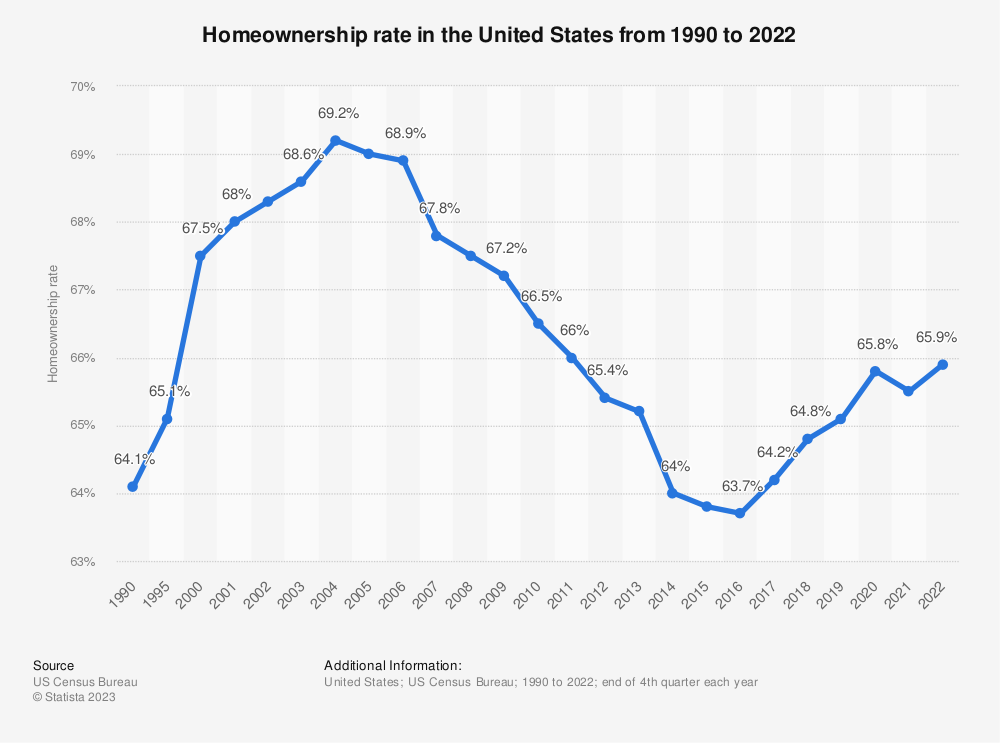
Source: Statista and US Census Bureau
In 2022, U.S. homeownership reached 65.9%, its highest since 2011, after falling post the 2007-2009 recession until 2016. Despite this decline, Americans consistently viewed homeownership as integral to their personal dream.
Looking ahead, while homeownership rates among seniors are decreasing, most Millennial renters aim to purchase homes soon. With Millennials predicted to lead most households in the coming 20 years, homeownership remains a significant future trend.
Average Sales Price of New Homes in 2022
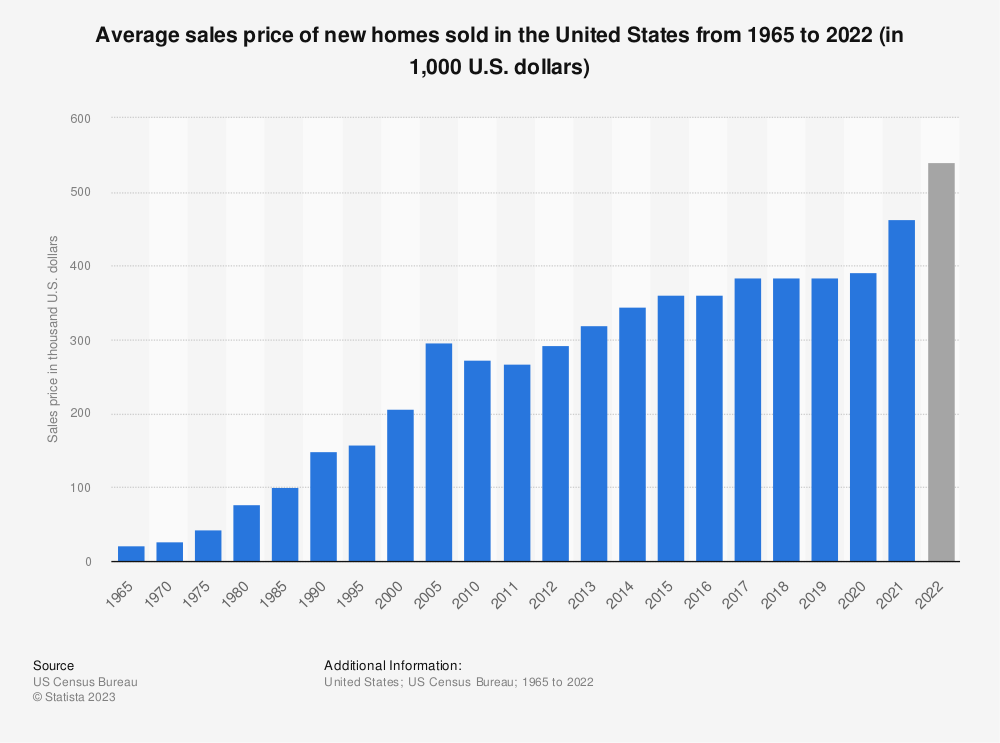
Source: Statista and US Census Bureau
Between 2017 and 2019, U.S. house prices stabilized but surged in 2021 and 2022 from an average of $391,900 in 2020 to $540,000 in 2022. This spike was primarily fueled by historically low mortgage rates, with 15-year mortgages dropping below 2.5% in 2020 and 2021.
As a result, housing transactions in 2021 soared to nearly seven million. Additionally, the COVID-19 pandemic bolstered Americans’ interest in homeownership in 2020. A survey revealed 28% of Millennials were more inclined to buy homes due to the pandemic, while only 13% were deterred.
Number of Households in 2022
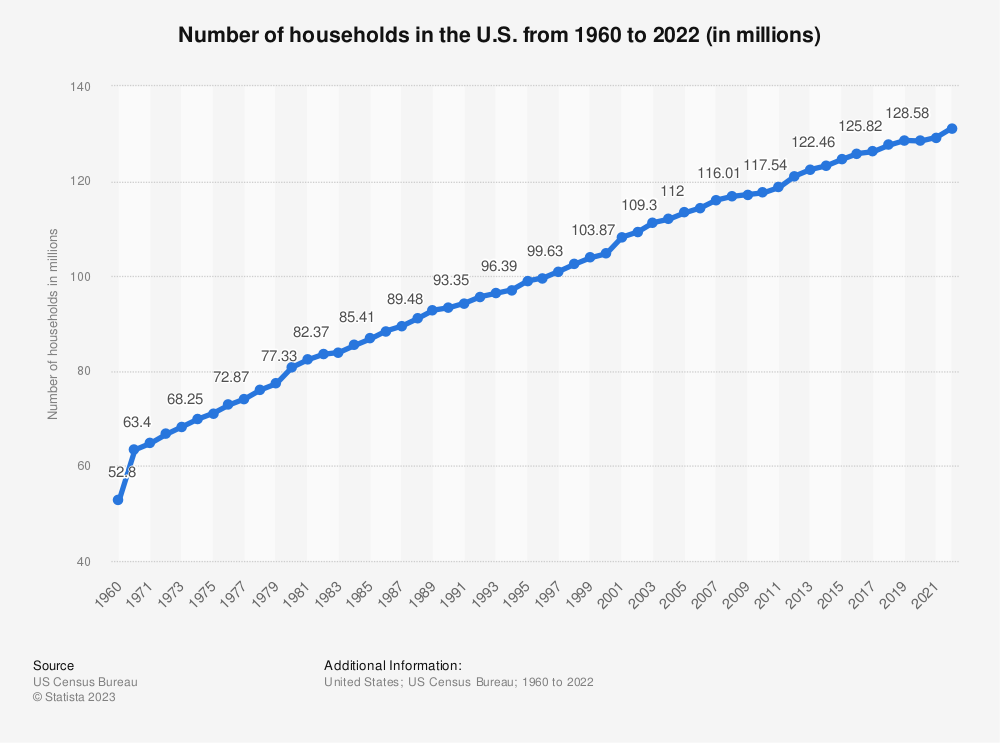
Source: Statista and US Census Bureau
In 2022, the U.S. had 131.2 million households, up from 52.8 million in 1960.
Leading Home Builders in 2022
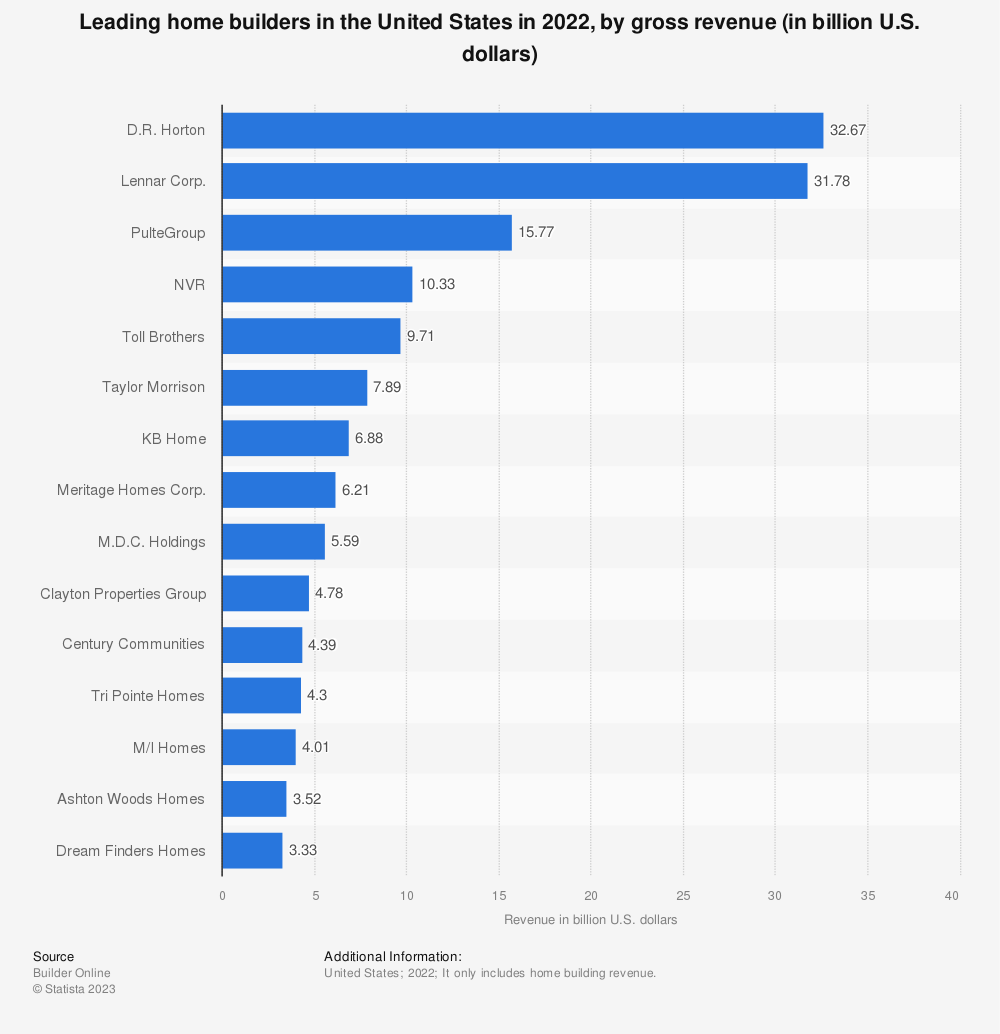
D.R. Horton led in gross revenue, followed closely by Miami-based Lennar Corporation, which generated around $32 billion. For Lennar, homebuilding was their primary revenue source.
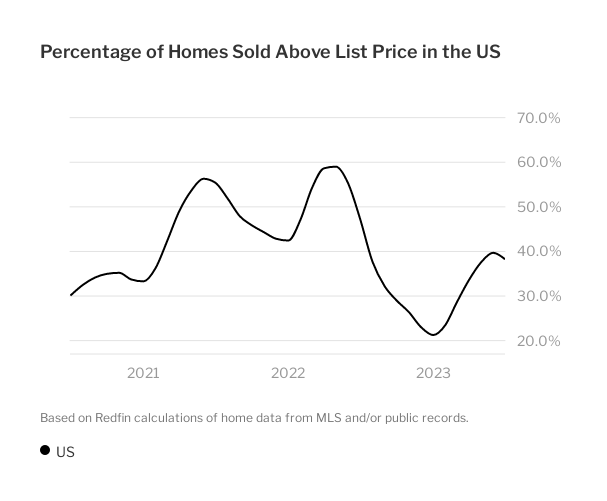
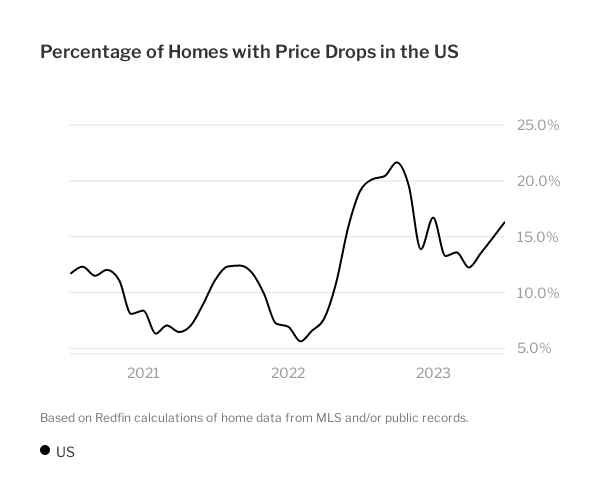
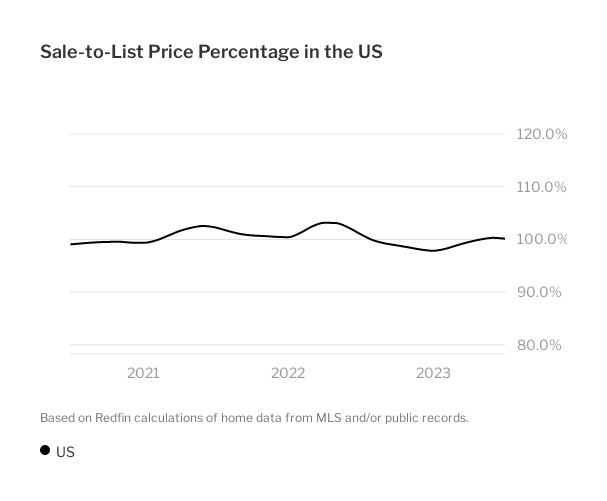
U.S. Housing Demand: How Competitive Is the Market In 2023?
Source: Redfin
Source: Redfin
Source: Redfin
The 3 graphs above show that in July 2023, only 38.3% of U.S. homes were sold for less than their asking price, a decrease of 9.03 points compared to the previous year. Just 16.3% of homes experienced price reductions, a dip from 19.0% during the same month last year. The ratio of sale-to-list price stood at 100.1%, a decline of 0.9 points from the year before.
Home Purchases By Age Group in 2022
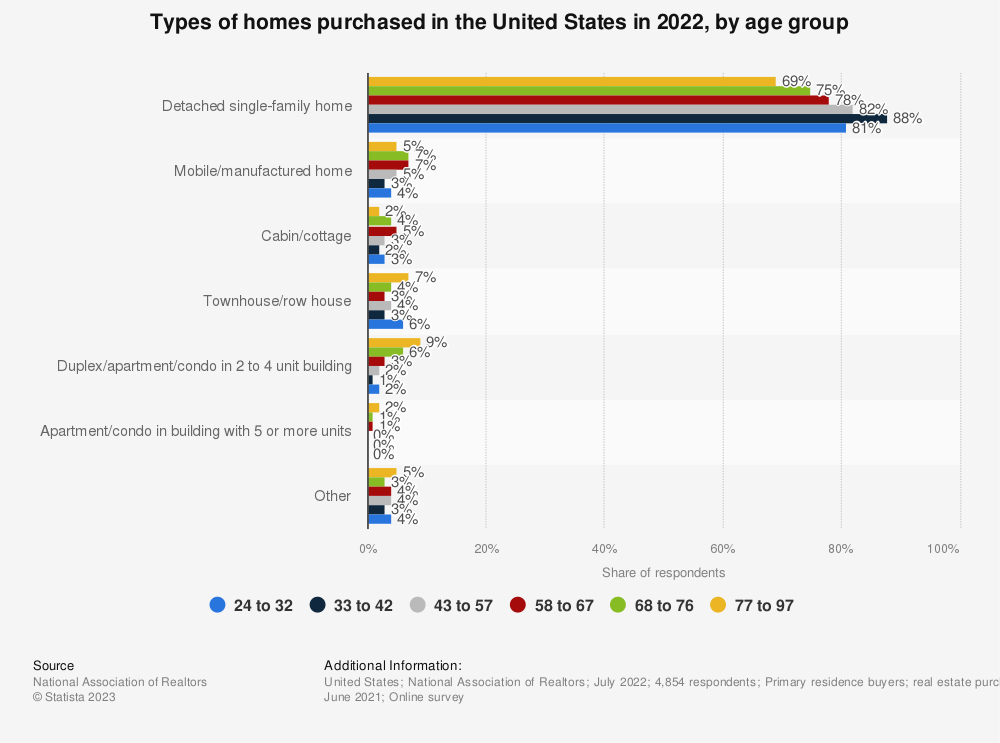
Source: Statista and National Association of REALTORS®
Over 81% of Gen Z, Millennial, and Gen X home buyers in the US chose detached single-family homes in 2022.
U.S. Home Purchase Trends in 2021:
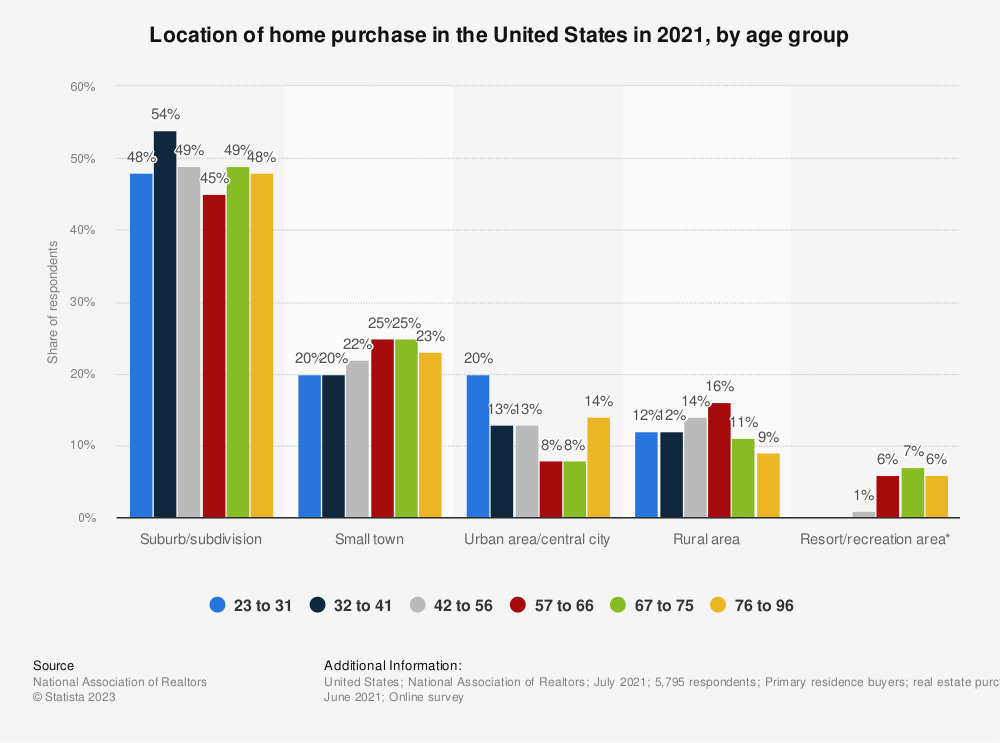
Source: Statista and National Association of REALTORS®
Research Group
Across all age groups, the suburbs or subdivisions were the most favored locations for home purchases, attracting at least 45% of buyers. Conversely, resort or recreational areas were the least popular among all age demographics.
Trends in U.S. Migration Patterns: Which regions are attracting and losing residents?
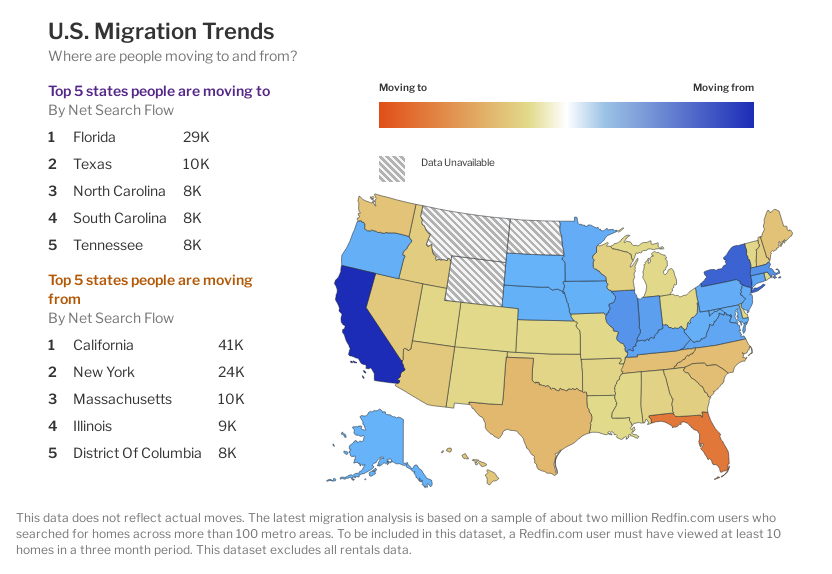
Source: Redfin
From June to August 2023, about one-fourth (26%) of potential homebuyers were considering a move to another metropolitan area. The most popular states they explored were Florida, Texas, North Carolina, South Carolina, and Tennessee. Conversely, the most common states people wanted to leave were California, New York, Massachusetts, Illinois, and the District of Columbia.
When examining specific cities, Sacramento led the list as the preferred choice for those wanting a change in location between June and August 2023. Cities like Las Vegas, Orlando, Sarasota, and Tampa closely followed this. On the other hand, San Francisco was at the top of cities people were keen to move away from, with New York, Los Angeles, Washington, and Louisville also on the list.
Mortgage Rates 2023
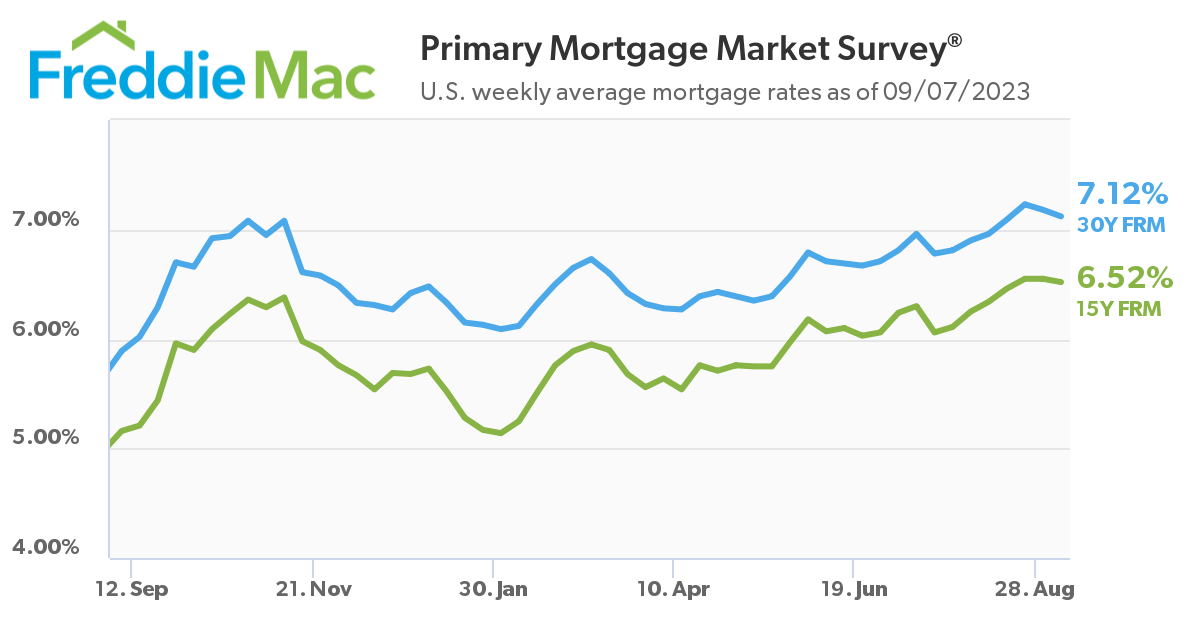
Source: FreddieMac
For August 2023, the rate for a 30-year fixed mortgage consistently exceeded 7% and 6% for a 15-year fixed mortgage. A thriving economy offers hope for consumers. However, even with slowing inflation, stronger economic indicators are nudging mortgage rates upward, posing hurdles for prospective homeowners.
Building Permits Issued up to July 2023 for Residential Construction
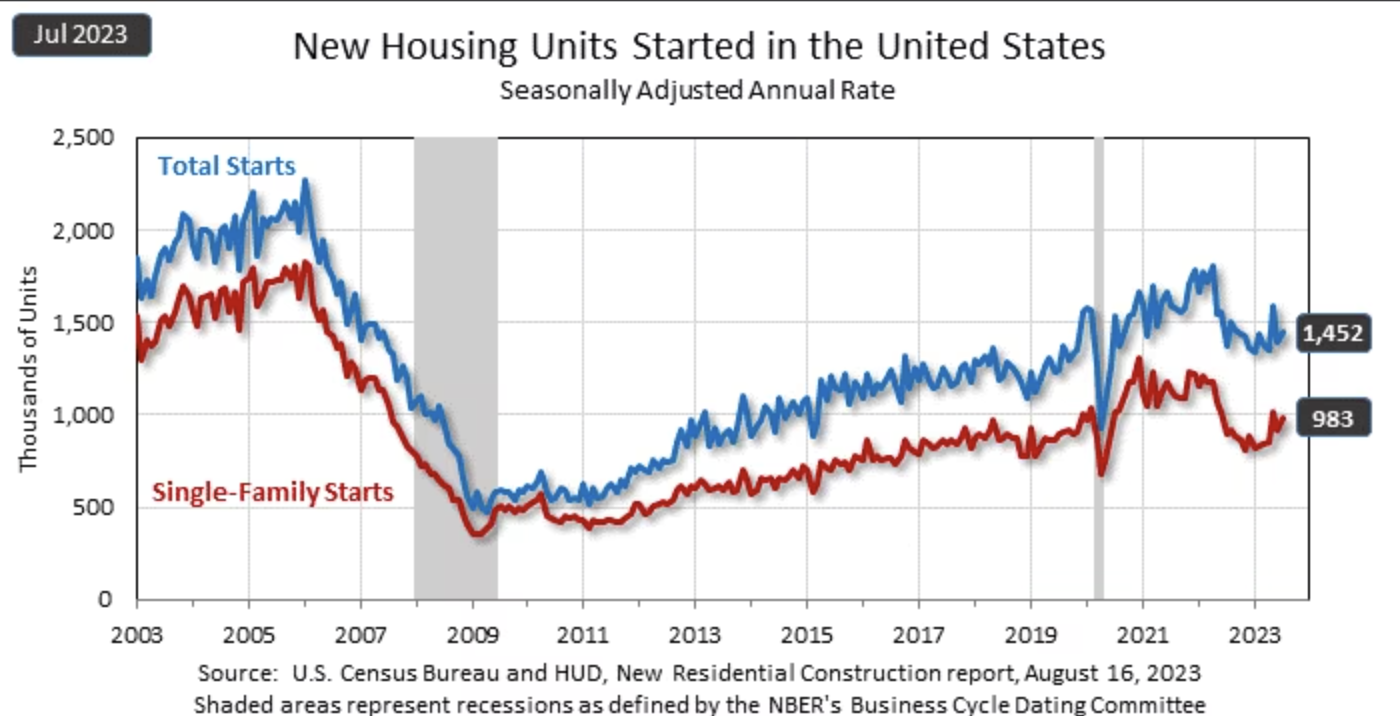
A report in August 2023 by the U.S. Census Bureau and HUD showed that building permits stood at 1,442,000, marking a 0.1% rise from June but a 13% decline from July 2022. Housing starts were 1,452,000, a 3.9% increase from the prior month and a 5.9% rise year-over-year. Meanwhile, housing completions totaled 1,321,000, an 11.8% drop from June and a 5.4% decrease from July 2022.
Home Buyers and Sellers Statistics for 2022
A report by The National Association of Realtors showed that:
- A significant 73% of buyers financed their home purchase.
- Interestingly, while 32% opted for a larger home, a similar percentage traded down in size.
- Most recent buyers, 88%, were under the age of 62, emphasizing a younger demographic in the buying space.
- Buyers’ concerns centered primarily on home affordability, cited by 37%, and availability, noted by 28%.
- The importance of real estate professionals was evident, with a substantial 87% of buyers purchasing homes through agents.
- This trend is further emphasized by the higher average sale price of homes sold with the assistance of agents ($345,000) compared to those sold by owners ($225,000).
- The year also saw a positive outlook on real estate investments, with 60% of buyers viewing home purchases favorably and 56% anticipating price increases.
U.S. Real Estate Insights By State: A Comprehensive Examination of Texas Trends
Texas Home Sales 2022
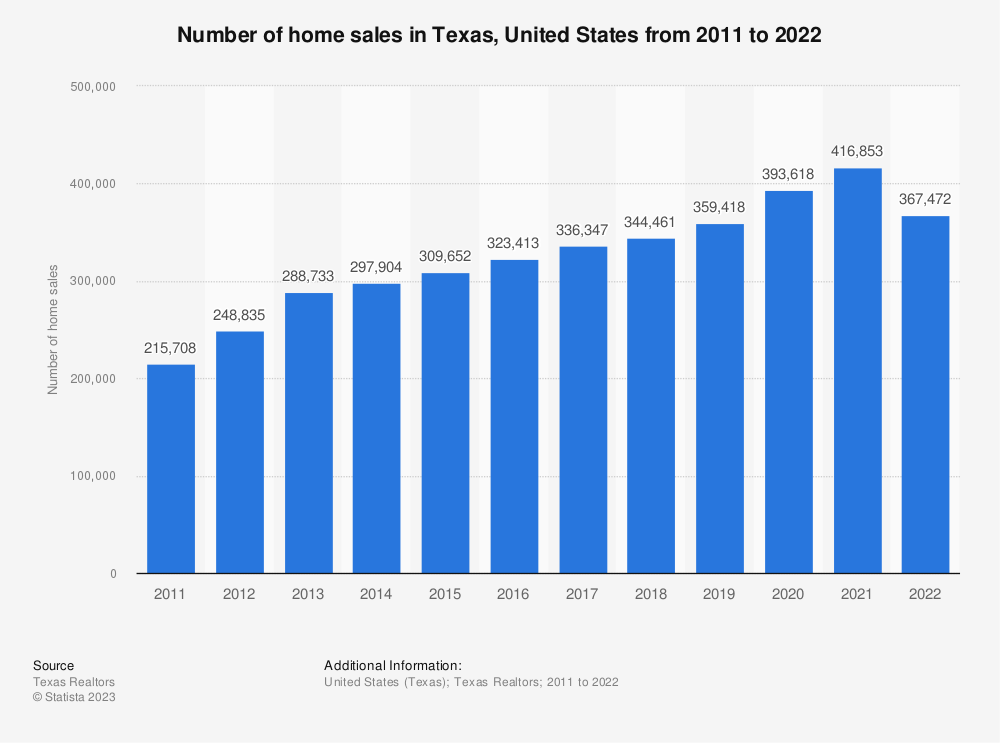
Source: Statista and Texas Realtors
Home sales in Texas dropped to 367,000 in 2022 from a record 417,000 in 2021, with high demand driving notable price increases.
Texas Office Space Asking Rent in 2023
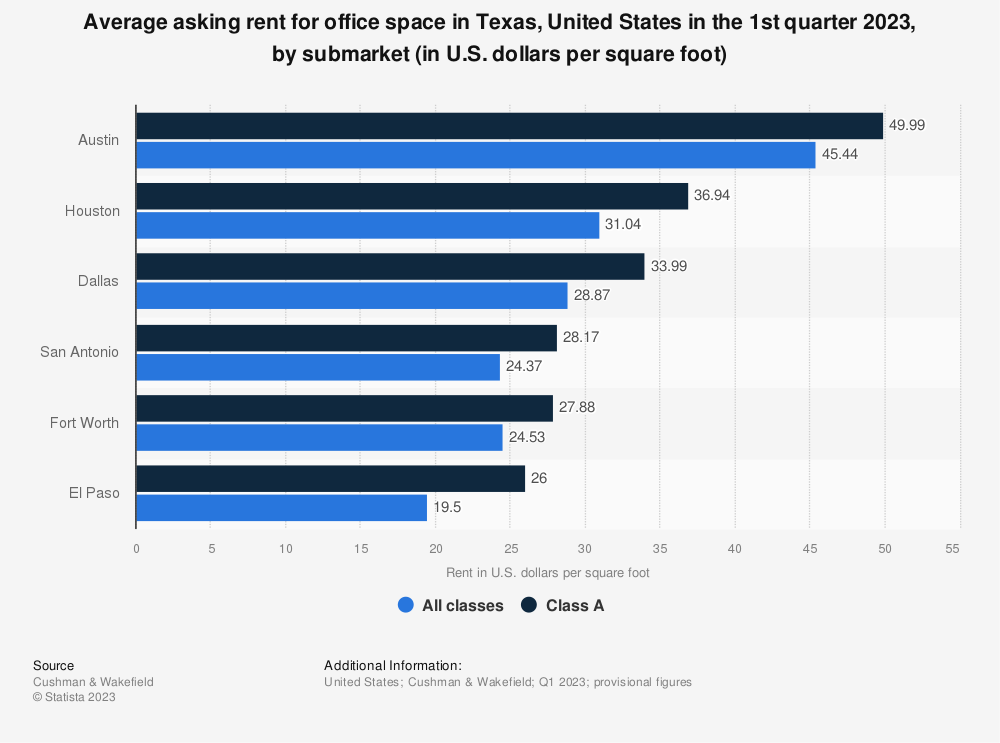
Source: Statista and Cushman & Wakefield
In Q1 2023, Austin had the priciest office space in Texas at roughly $50/sq. ft. for class A offices. This compares to El Paso’s $26/sq. ft., and Dallas’s rates of $29/sq. ft. for all classes and $34 for class A. Nationally, Manhattan, San Francisco, and Silicon Valley-South Bay commanded the top rental rates.
Texas Average Monthly Asking Rent 2023
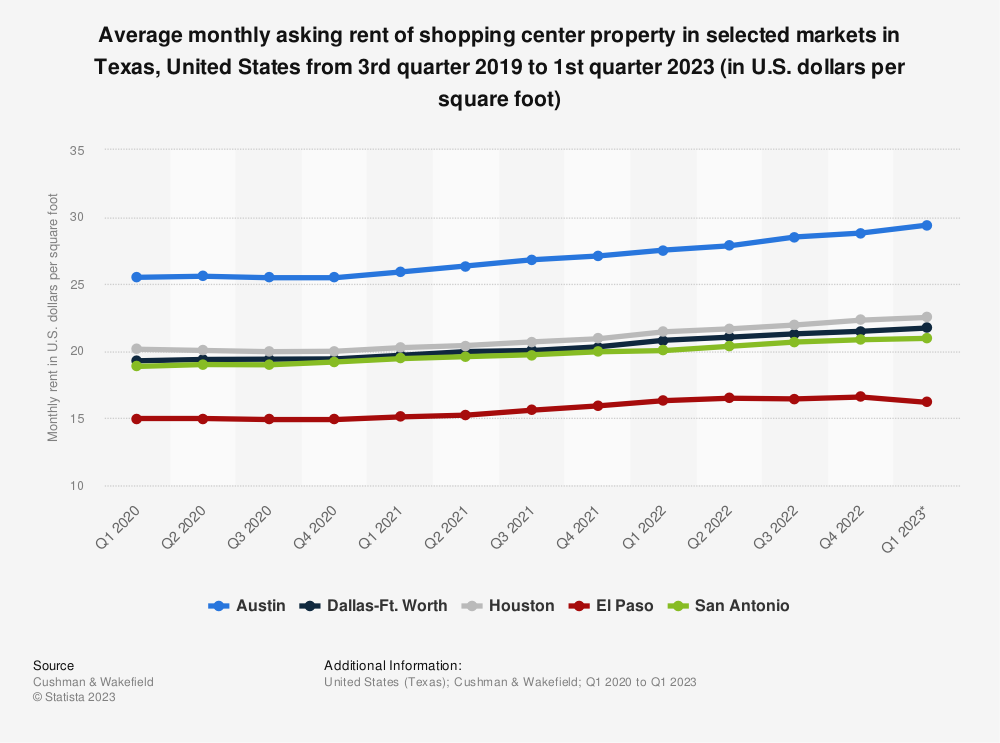
Source: Statista and Cushman & Wakefield
The monthly rent per square foot for shopping centers in Texas’s top markets rose from Q1 2020 to Q1 2023. Austin led with $29.4/sq—ft. in 2023, surpassing both the national and South region averages.
Texas Office Space Vacancy Rates in 2023
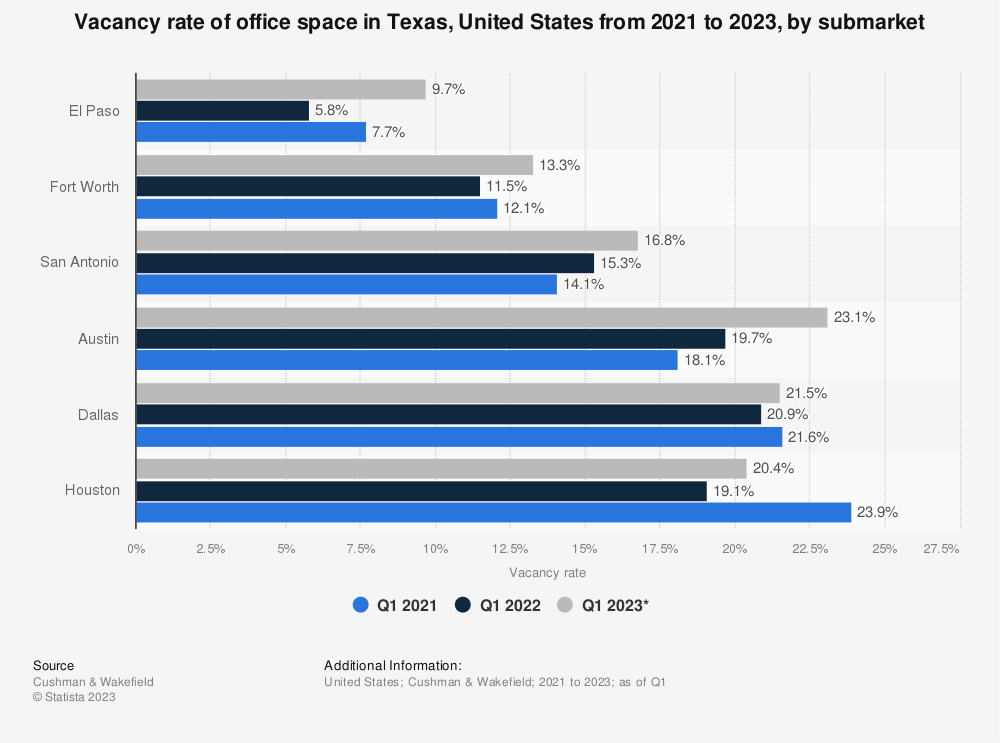
Source: Statista and Cushman & Wakefield
In 2023, El Paso had the lowest office vacancy rate in Texas at approximately 10%. In contrast, Houston had around 23% of its office space vacant. Dallas, the state’s largest office market, had the second-highest vacancy rate. The U.S. office sector has seen a rise in vacancies since the coronavirus pandemic.
Uptown Dallas Office Real Estate 2023
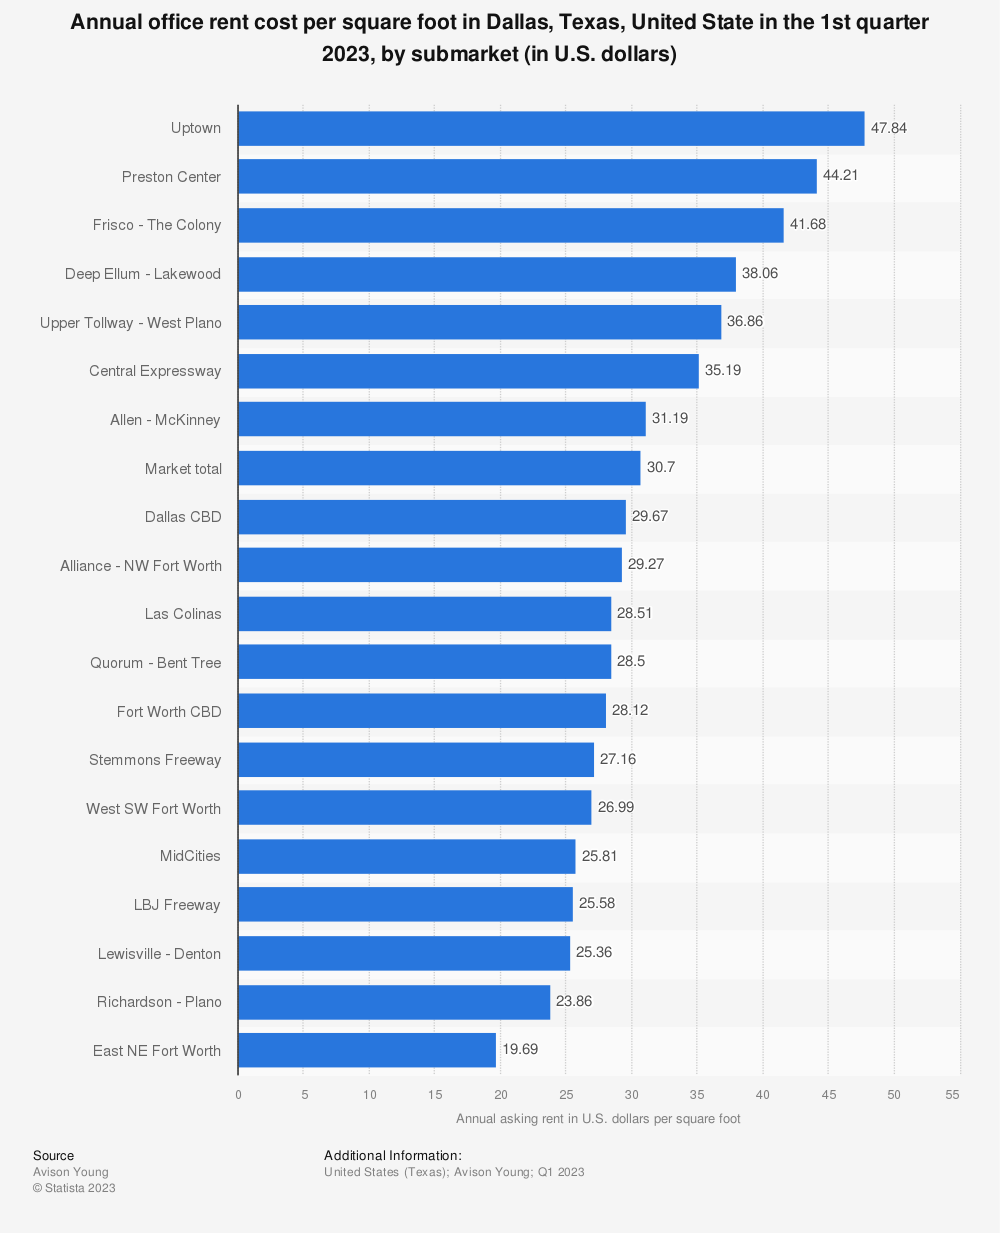
Source: Statista and Avison Young
Uptown Dallas topped the Dallas-Fort Worth market with office rental rates at $48/sq. ft., while East NE Fort Worth was at $20/sq. ft. Dallas had Texas’s largest office inventory, but Austin recorded the highest rental rates.
The Bottom Line
As detailed in the preceding data, the U.S. housing market continues its dynamic interplay of supply, demand, and external factors. With a staggering overall estimated value of $43.4 trillion and a median home price of $436,800, the market showcases both immense growth and the challenges facing prospective buyers.
Factors such as the pandemic have undoubtedly influenced buying patterns, with 28% of Millennials inclined to buy due to the situation. Yet, concerns like affordability and availability are legitimate for many.
The varying data from states such as Texas further emphasizes regional disparities, indicating that location remains a crucial factor in the housing narrative. The trends, from mortgage rates to office space prices, give us a glimpse into the changing landscape of the real estate market, revealing a complex web of opportunities, challenges, and evolving buyer preferences.
FAQ Section
How does the U.S. housing market value compare with other countries?
While this article focuses on the U.S., the American housing market’s estimated value is among the highest globally. However, comparisons can be tricky due to currency differences, home sizes, and overall land availability. Countries like the U.K. and Australia also have robust markets, but the U.S. remains unique, given its sheer size and diversity.
Is the median home price rise consistent across all types of homes?
The article mentions the median price, but it’s important to note that this might vary for different types of homes, like condos, townhouses, or detached homes. Each category could have its own price trends.
What factors might be causing Millennials to consider buying homes due to the pandemic?
Millennials might be influenced by a combination of historically low mortgage rates, a desire for more space as remote work becomes commonplace, and the pursuit of stability during uncertain times.
How has the rental market been affected during this period?
The article primarily discusses home purchases, but generally, the rental market might shift due to the same factors affecting buying. Regions with increased home buying interest might witness rental stagnation or decline.
Are urban areas seeing a decline in interest compared to suburban or rural areas?
There’s a growing trend, especially post-pandemic, where people prioritize space and affordability, sometimes leading them toward suburban or rural areas. However, urban areas still have their appeal, especially for those valuing proximity to amenities and work.
How are commercial property prices affected by the changes in the housing market?
Commercial and residential markets can influence each other. A booming residential area might attract businesses and vice versa. However, with remote work on the rise, some commercial spaces, especially office buildings, might be seeing decreased demand.
Has there been an increase in housing constructions to meet the demand?
Typically, an uptick in demand leads to increased construction. However, this also depends on factors like land availability, zoning laws, and the overall economic situation.
How has the pandemic impacted the availability of mortgage loans?
The pandemic brought about economic uncertainties but also historically low mortgage rates. Lenders might have stricter criteria due to economic concerns, but many are still willing to provide loans, especially with the enticing rates.
Are there specific regions in the U.S. that are more resilient to housing market fluctuations?
While the article highlights trends and state-specific data, traditionally, areas with diversified economies or unique draws (like tech hubs or tourism centers) might be more resilient to fluctuations.
How might the U.S. housing market trends influence global real estate trends?
The U.S. market often serves as an indicator of global trends. Investors worldwide might take cues from U.S. patterns, either directly investing or adapting strategies in their home countries based on observed American behaviors.